Over Half a Million People Self-Identified as Brazilian in 2020 Census
For the first time in U.S. Census Bureau history, the official counts for 22 detailed groups that are classified as Some Other Race (SOR) were tabulated from the race question.
Written by: Jessica E. Peña, Ricardo Henrique Lowe Jr. and Ana I. Sánchez-Rivera
October 24, 2023: Many of these detailed groups are usually tabulated from the ancestry question in the American Community Survey but these data come from recently released 2020 Census detailes data files.The SOR category includes non-Hispanic groups (such as Mauritanian), Multiracial and Multiethnic responses (such as “Biracial”) and Hispanic responses (such as “Mexican”) to the race question.
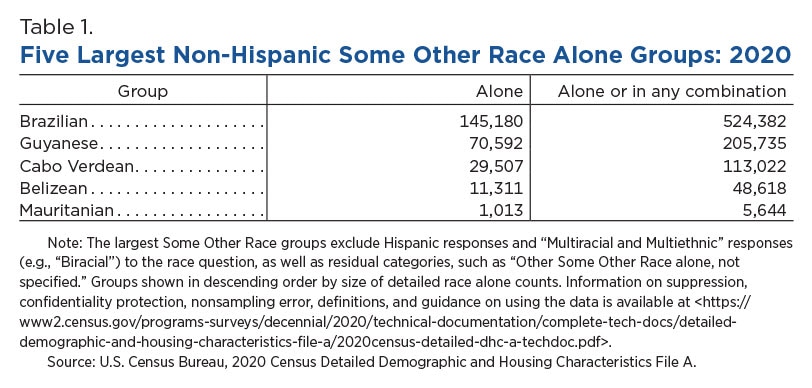
Brazilian was the largest SOR group reported in the 2020 Census race question (excluding Hispanic responses and Multiracial and Multiethnic responses such as “Biracial”). Brazilian was followed by Guyanese, Cabo Verdean, Belizean, and Mauritanian.
The three largest non-Hispanic SOR groups (excluding Multiracial and Multiethnic responses) were Brazilian, Guyanese, and Cabo Verdean. Each of these three groups were concentrated in the Northeast region of the United States and Florida.
The vast majority of race responses (90.8%) that are classified as Some Other Race were from people who were classified as Hispanic in the ethnicity question (45.3 million out of the 49.9 million who identified as Some Other Race alone or in combination).
While Hispanic write-in responses comprise the majority of the SOR population, the main focus of this article is to highlight the non-Hispanic detailed groups that comprise the remainder of the SOR population.
Some Other Race
The SOR category includes people who only selected the Some Other Race checkbox and those who provided a detailed write-in response categorized as Some Other Race on any of the race write-in areas.
When defining, coding and tabulating ethnicity and race data, the Census Bureau follows the 1997 Standards for Maintaininbg, Collecting, and Presenting, Federal Data on Race and Ethnicity directed by the U.S. Office of Management and Budget (OMB).
The Census Bureau is required by the U.S. Congress to use the category Some Other Race for the decennial census and the American Community Survey. The SOR category includes all other responses not included in the five minimum race categories defined in the OMB standards (White, Black or African American, American Indian or Alaska Native, Asian, and Native Hawaiian or Other Pacific Islander).
If responses to the race question can be classified as one or more of the five OMB race groups, they are coded as such and are not classified as Some Other Race. For example, responses of Irish and Lebanese were coded and tabulated as White because the 1997 OMB standards state that White refers to a person having origins in any of the original peoples of Europe, the Middle East, or North Africa.
In this article, we present data on SOR groups using two concepts: “race alone” and “race alone or in any combination.” The race alone population includes those who reported one detailed response (such as Brazilian) and no other responses. The race alone or in any combination population includes those who reported one detailed response (such as Brazilian) and includes those who reported multiple responses (such as Brazilian and Portuguese or Brazilian and White).
The race alone or in any combination population represents the maximum number of people who identified as that detailed group. These concepts are important to frame the discussion of racial and ethnic composition and help us understand our country’s changing demographics as it becomes much more multiracial.
Brazilian Population Numbered Over Half Million
Brazilian was the largest SOR group reported in the 2020 Census race question (excluding Hispanic responses and Multiracial and Multiethnic responses such as “Biracial”). Among the SOR alone groups, Brazilian was followed by Guyanese, Cabo Verdean, Belizean, and Mauritanian (Table 1).
In 2020, the Brazilian alone count was 145,180, and the Brazilian alone or in any combination count was 524,382. The Guyanese alone or in any combination count was 205,735, followed by the Cabo Verdean alone or in any combination count at 113,022.
Brazilian and Cabo Verdean Populations Among the Youngest
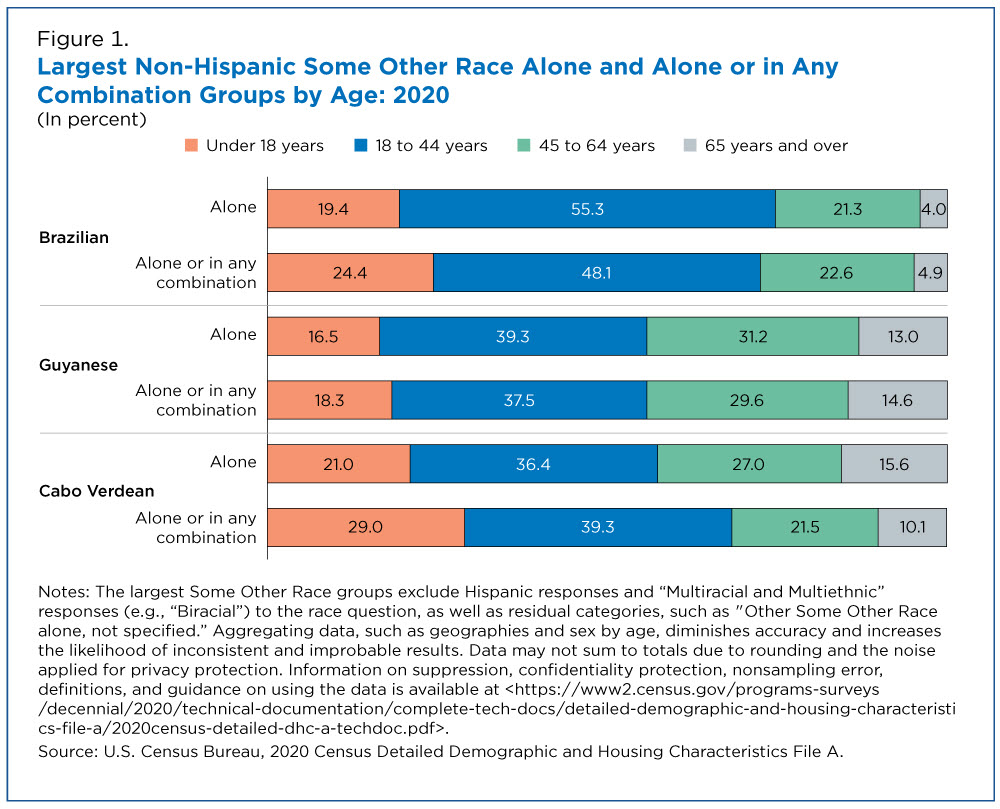
Approximately 29% of the Cabo Verdean alone or in any combination population was under the age of 18 — the largest proportion among SOR groups (Figure 1).
The Brazilian alone (76.6%) and alone or in any combination (70.7%) populations had the largest working-age (ages 18 to 64) share of their populations.
Over 44% of the Guyanese alone and alone or in any combination populations were over 45 years old.
Brazilian and Cabo Verdean Populations Concentrated in Massachusetts
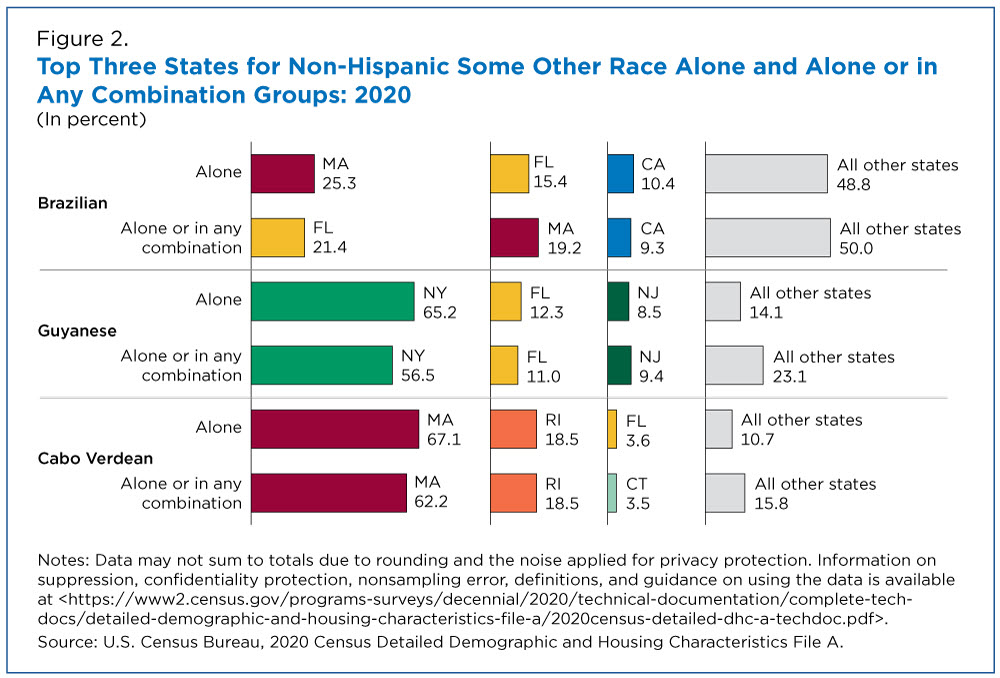
The Brazilian, Guyanese, and Cabo Verdean populations were concentrated in several states in the Northeast including Massachusetts, New York, Rhode Island, New Jersey, and Connecticut, as well as Florida and California (Figure 2).
Over two-thirds (67.1%) of the Cabo Verdean alone population and over a quarter (25.3%) of the Brazilian alone population called Massachusetts home in 2020.
New York had the largest Guyanese alone or in any combination population in 2020 at 116,298. Over half of all Guyanese alone (65.2%) and alone or in any combination (56.5%) populations lived in New York.
Over Half of all Guyanese Alone Population was in New York City
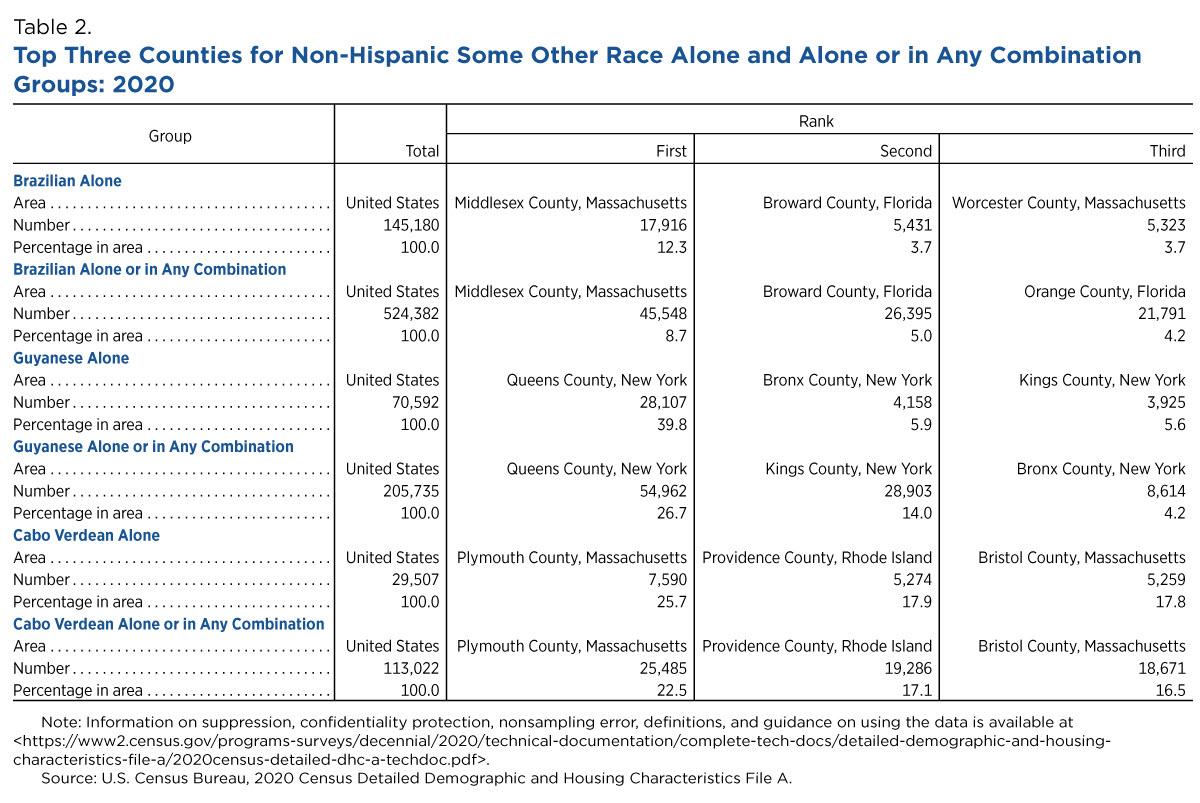
The Guyanese alone population was primarily concentrated in three New York City boroughs: Queens County (39.8%); Bronx County (5.9%); and Kings County (5.6%) (Table 2). Together, this constituted more than half of the Guyanese alone population in the United States.
Two counties in Massachusetts (Plymouth and Bristol) had 43.5% of the Cabo Verdean alone and 39.1% of the alone or in any combination populations in the country.
Of the three largest SOR groups, Brazilians were not as geographically concentrated:
- Two of the top three counties with the largest Brazilian alone population were in Massachusetts (Middlesex and Worcester counties).
- Two of the top three counties with the largest Brazilian alone or in any combination population were in Florida (Broward and Orange counties).
- Middlesex County, Massachusetts was home to the largest Brazilian alone and alone or in any combination populations.
Majority of Multiracial and Multiethnic Write-in Responses Reported in California
The SOR population also includes Multiracial and Multiethnic write-in responses such as “Mixed,” “Biracial,” or “Multiracial.” Multiracial and Multiethnic responses are classified as Some Other Race as they cannot be assigned to any of the five OMB race categories.
The Census Bureau recognizes that the Multiracial and Multiethnic population is not limited to the tabulation of these specific write-in terms. The Multiracial population also includes people who identified as more than one race. Previously released 2020 Census data explained that this population increased by 276%, growing from 9 million in 2010 to 33.8 million in 2020. The counts provided in this story should be interpreted as the number of times these terms were provided as responses to the race question.
Of the 467,447 Multiracial and Multiethnic write-in responses alone, more than 63% reported as “Mixed” (298,856). The second-most common alone response was “Biracial” (83,307), followed by “Multiracial” (48,020). Almost 1.9 million reported Multiracial and Multiethnic write-in responses alone or in any combination across the country with “Mixed” alone or in any combination (1,660,942), comprising 88.3% of these responses.
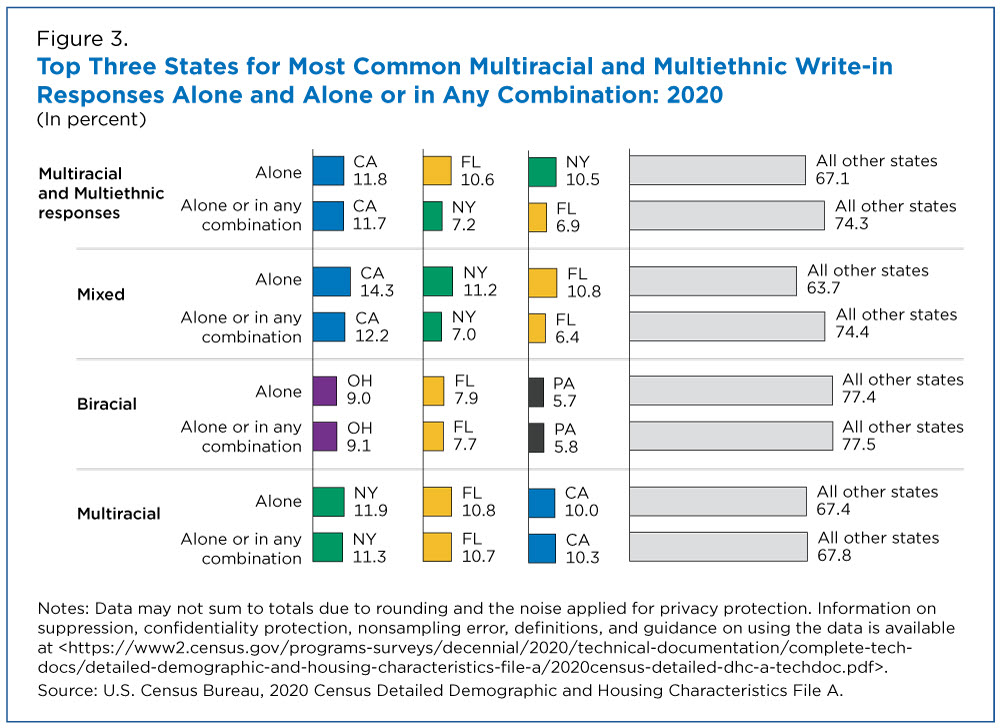
Nearly 12% of all Multiracial and Multiethnic write-in responses were reported in California in 2020 (Figure 3). This is true for both the Multiracial and Multiethnic alone and the alone or in any combination write-in responses.
The term “Mixed” was reported most-often in California with over 14.3% (42,767) reporting as “Mixed” alone and 12.2% (202,688) as “Mixed” alone or in any combination.
The term “Biracial” was reported most often in Ohio, Florida, and Pennsylvania. The number of people reporting “Multiracial” alone and alone or in any combination was evenly distributed across New York, Florida, and California.


